

Two Declarations
September 12, 2026
The men who flew airplanes into the World Trade Center twenty-five years ago yesterday morning were not attacking office space. They were attacking a system, and they said so plainly. Osama bin Laden spoke repeatedly of bleeding the American economy, and the towers were chosen for what their name announced: world trade. I have thought about that a good deal this year, because 2026 is also the year the country turns 250, and the two anniversaries sit strangely together, one a day of funerals and the other a year of parades. What strikes me is that they point at the same object. In 1776 two documents appeared four months apart. In March, Adam Smith published The Wealth of Nations, which described how self-interest coordinated through voluntary exchange produces a prosperity no planner could design. In July, Jefferson’s Declaration asserted the personal liberty that makes the pursuit of that self-interest a right rather than a privilege. One supplied the machinery and the other supplied the permission. Bin Laden aimed at what those two documents built.
He failed, and the ledger says by how much. Bespoke notes this week that the total return of the S&P 500 from the close on September 10, 2001, the last session before the attacks, through Thursday is 1,007%, an annualized gain of 10.1%. Better than a ten-bagger. It was not a straight line and I want to be clear about that, because the full story is the more useful one. Equities fell better than 11% in the first week back, the ultimate low of the dot com bust did not arrive for another thirteen months, and an investor who bought the reopening sat through a further decline of roughly a quarter before any of the compounding began. The lesson is not that markets shrug off catastrophe. It is that a system resting on those two documents is distributed across three hundred million people making their own decisions, which is why the exchanges reopened in six days with lower Manhattan still burning, and why the compounding resumed. That is the long view, and I hold it as firmly as I hold anything. What follows is the short view, and the short view this week calls for care.
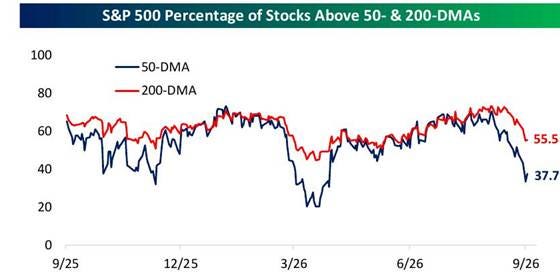
Percentage of S&P 500 members above their 50-day and 200-day averages. Source: Bespoke.
Market Technicals
Bull markets do not end on a day. They end through a process, and I believe that process has been underway since June. I have leaned on the Lowry system for most of my career, and its central insight, published continuously since 1938, is that major tops are built by a gradual withering of demand that shows up in advance-decline statistics long before it shows up in the averages. Distribution is a process, not an event. Earlier this year better than 70% of S&P 500 members traded above both their 50-day and their 200-day moving averages. As of Thursday, per Bespoke, 55.5% remain above the 200-day and only 37.7% above the 50-day, the worst readings since the spring. That is not a wobble. That is participation draining out of a market whose index level has barely moved.
The sequence matters more than the levels. The leadership complex topped first: memory stocks peaked on June 22 and fell more than 40% into late July, the semiconductor index has traded under a downtrend line from its June high ever since, and the Nasdaq never made a new high in August at all. The S&P 500 did make a marginal new high on August 13, but it made it on the shoulders of a handful of mega caps while the equal weighted index and the Russell 2000 broke their 50-day averages and kept going. The cumulative advance-decline line, which I treat as a leading indicator rather than a confirming one, has now broken its uptrend and sits more than two standard deviations below its 50-day average, a first percentile reading going back to 1990. That is precisely the divergence Lowry teaches you to respect, the index holding its ground while the market beneath it narrows. I am watching the percentage above the 200-day above all else. If it holds over 50% and turns back up while the index consolidates, I will read the last month as rotation rather than distribution, and I will be the first to say so. If it breaks 40%, the process is further along than I currently think.
Market Fundamentals
The market did not slow on its own. It slowed because the economy did, and the timing lines up too neatly to set aside. Bespoke’s Matrix of Economic Indicators counts how many measures are accelerating year over year, and through May the reading had climbed to plus 21, the strongest since 2024 and the fourth consecutive positive month. By July it was minus 13. That thirty-four-point reversal over two months is the third largest since 1999, behind only March 2020 and June 2021, and it began in June, the same month the leadership groups rolled over. Housing carried much of the damage, with starts down better than 13% from a year ago, and six of seven consumer measures deteriorated. Manufacturing was the lone bright spot. This is a deceleration in momentum rather than a stall, and I want to be careful not to overstate it, but a market narrowing at the same moment the data turns gives me two separate arguments arriving at the same conclusion.
What makes it harder is that the two things which actually price equities have both moved against us. Crude crossed $100 this week. The ten year Treasury sits within a hair of its fifty two week high, and two-year yields have added nearly forty basis points since Chairman Warsh spoke at Jackson Hole on August 28. The market now prices a rate hike at next week’s meeting at 87%, up from 60% on Wednesday. High oil and high yields are simply a headwind to equity prices, and until at least one of them relents it will be difficult for this market to do much more than churn. A central bank tightening into decelerating data is the 1994 problem I wrote about two weeks ago, and it remains the single largest risk I see between here and year end. If crude rolls back under ninety and the ten-year backs away from its highs, the fundamental case improves in a hurry and my technical caution will have amounted to a month of chop. If both keep climbing while the Matrix stays negative, both arguments point the same way and I will position accordingly.
Prognostication
I expect the low for this move to arrive in the middle of October, and I expect to be buying into it rather than selling out of it. Two weeks ago I wrote that fundamentals and technicals were handing me a split decision, and that the right answer was Richard Russell’s: don’t just do something, stand there. They are no longer split. Both now point the same way for the near term, and when my two confirmations agree I take them seriously. That does not make me bearish. It makes me patient, and patience in September has a specific shape to it. Bespoke’s work shows that virtually all of the month’s historical weakness comes in the second half, and that the average daily move keeps expanding until roughly October 20 before settling down into year end. We are entering the part of the calendar that does the damage, not leaving it.
I have watched markets long enough to trust a rhythm that most people dismiss as folklore. Markets almost always seem to bottom in mid-October. The crash low came on October 19 of 1987, the Gulf War low on October 11 of 1990, the Long Term Capital low on October 8 of 1998, the dot com low on October 9 of 2002, the European crisis low in the first days of October 2011, and the most recent bear market low on October 12 of 2022. Six of them, across six entirely different causes. I do not know why it clusters there and I would not bet a portfolio on a date, but I have seen it too many times to plan around anything else. What I intend to do is let the deterioration run its course, keep my list ready, and put money to work into weakness rather than waiting for the all clear, which in my experience never sounds until prices have already recovered.
The other reason for patience is what sits on the far side of October. This is a midterm election year, and in midterm years the twelve months following the September 30 close have averaged a gain of 19.47% since 1945, better than twice the average for all years. I would not lean on a seasonal statistic by itself, but it points the same direction as everything I believe about the decade, which is that the capital being poured into artificial intelligence today is the installation phase of a general purpose technology whose payoff arrives on a lag we cannot schedule. If mid-October passes and the percentage of S&P 500 members above their 200-day average is still falling, I will have been wrong about the timing and I will tell you so. Twenty five years ago the exchanges reopened in six days and went on to return better than ten times over. Two hundred fifty years ago two documents set that machinery in motion. Neither anniversary tells me a thing about October. Both tell me exactly what to do about the decade.
CJ Brott
Chairman Emeritus, Capital Ideas
Chart from Bespoke Investment Group. Other data from FactSet, Dow Jones, Yardeni Research, and Bespoke. This letter reflects my personal opinions as of the date above and is for informational purposes only. It is not a recommendation to buy or sell any security and is not personalized investment advice. Past performance is not a guarantee of future results.